Metropolitan Transportation Authority
Bus Lane Enforcement Study
CUNY Transit Analysis 2025

Bus Automated Camera Enforcement Analysis

Comprehensive evaluation of ACE program effectiveness and policy impact on NYC transit operations

Study Period & Scope
Analysis of 2+ million violation records (2024-2025) across all five boroughs with focus on student transportation equity and policy effectiveness
216K+
M101 Route Violations
Highest in dataset, serves multiple CUNY campuses
6%
Speed Decline
Camera-enforced routes (8.6→8.1 MPH)
75%
Congestion Pricing Success
CBD violation reduction post-implementation
43K+
Repeat Offenders
Exempt vehicles with multiple violations
🎓

Question 1: Student Transportation & ACE Effectiveness

Critical Finding: ACE Program Multi-Metric Failure
Camera-enforced routes serving CUNY students show declining performance across both speed and compliance metrics:
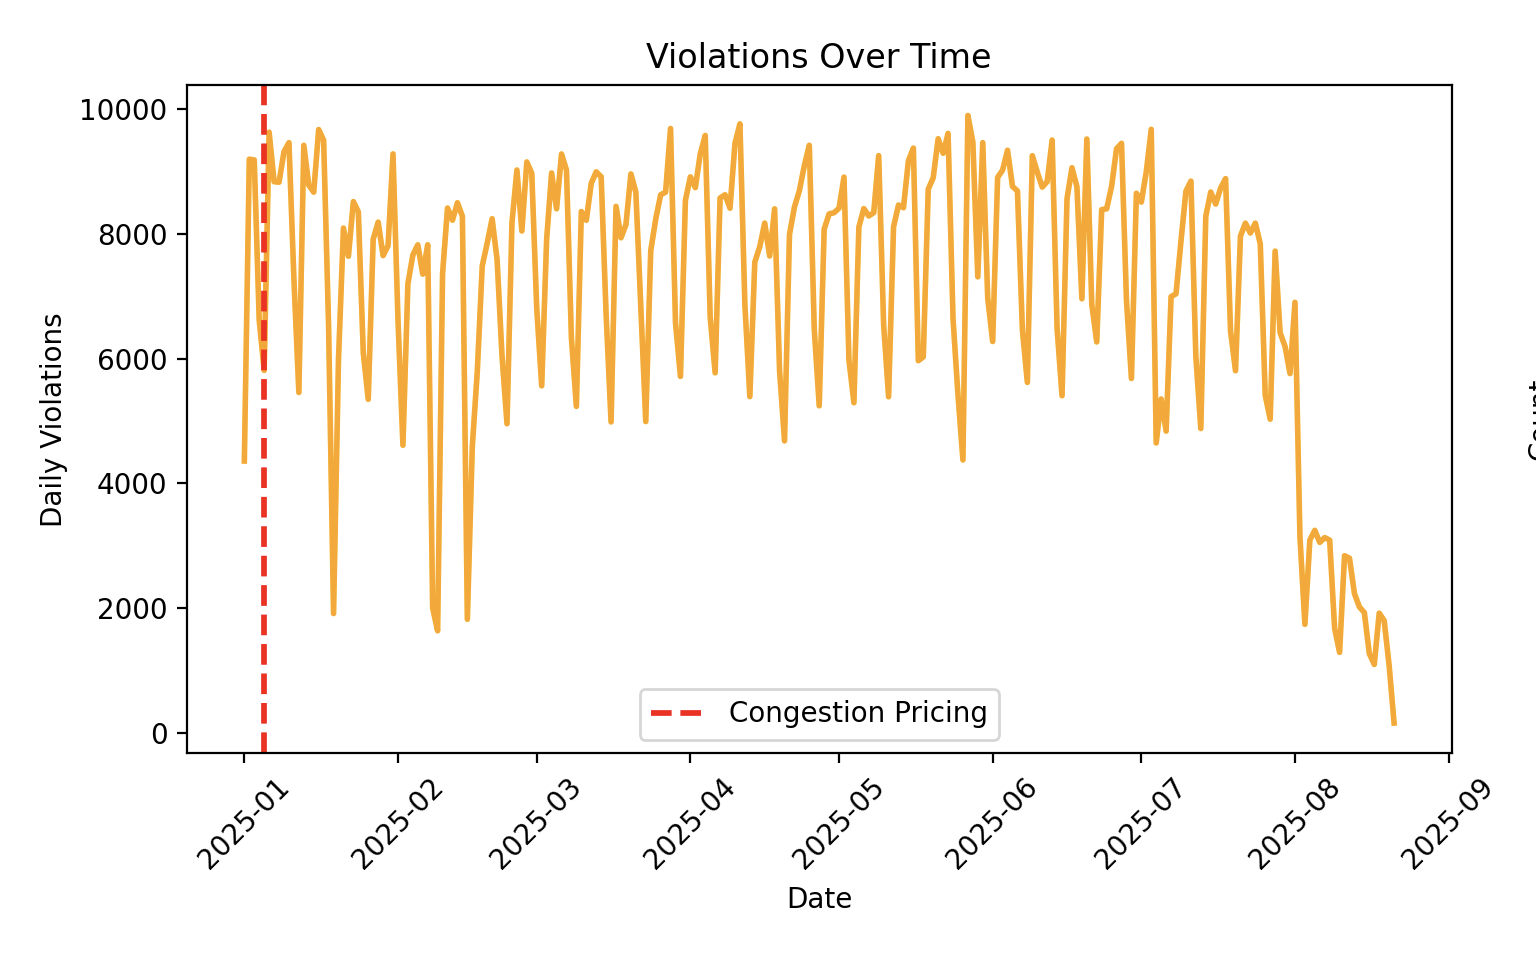
  • Speed Impact: 6% decline from 8.6 to 8.1 MPH (2023-2024)
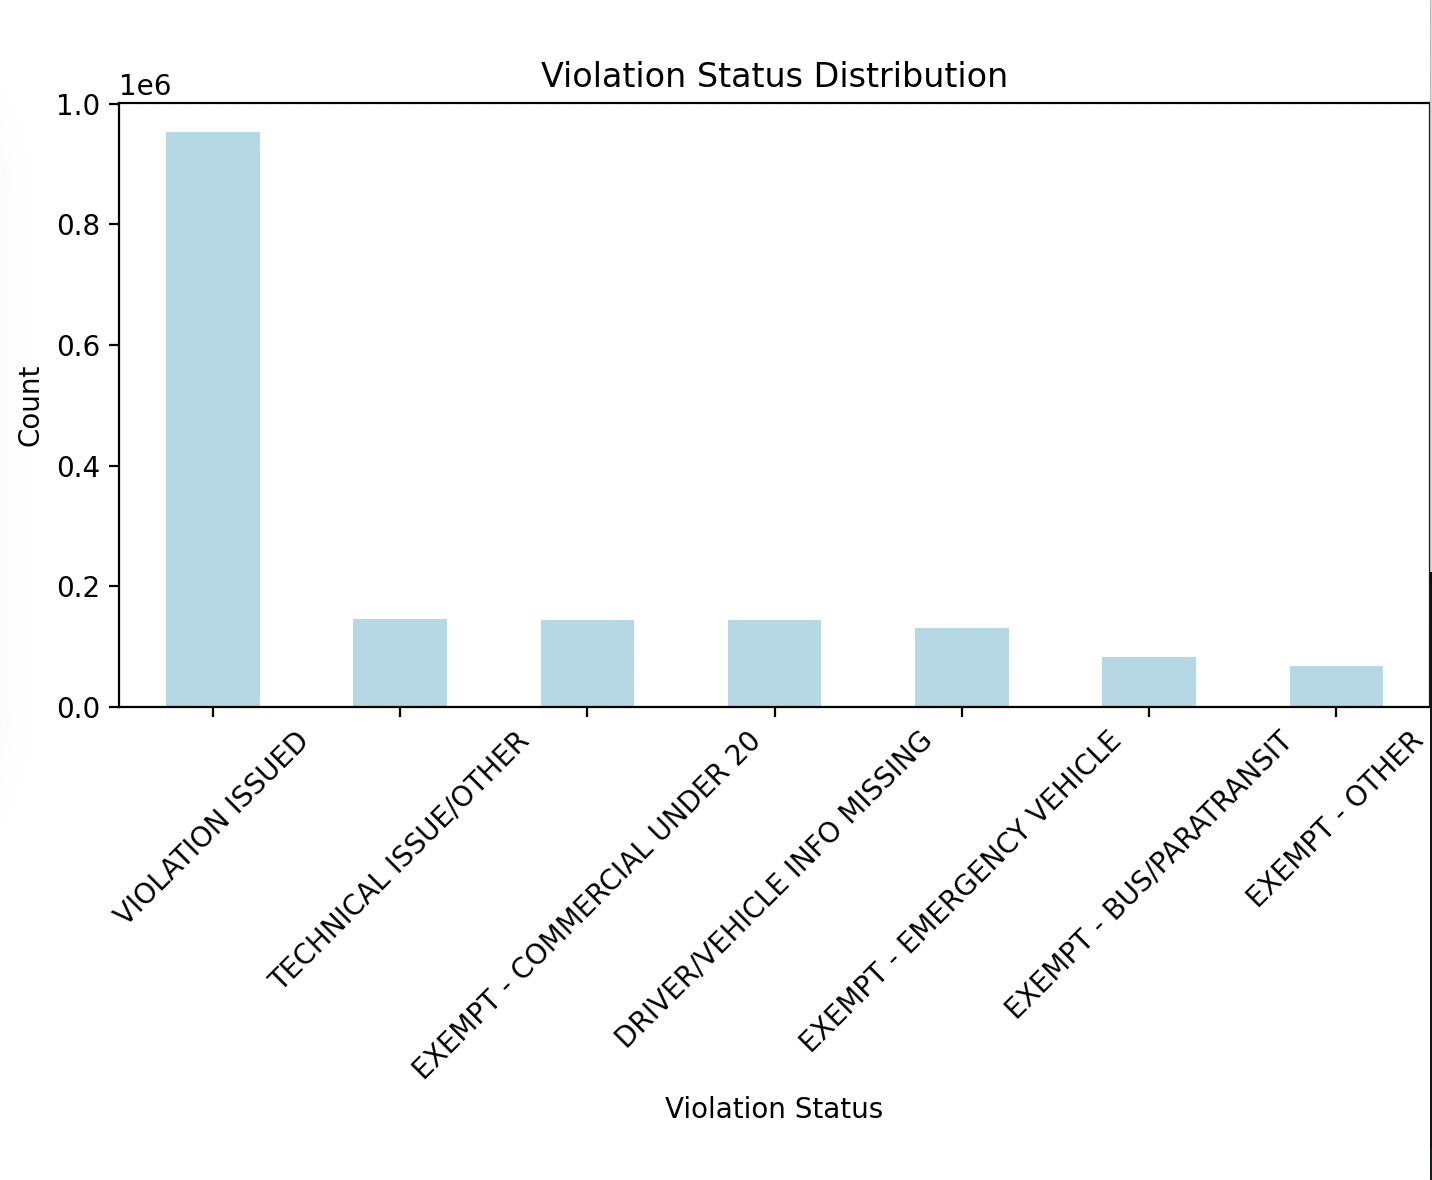
  • M101 Route: 216,155+ violations in 2025 data alone
  • CUNY Impact: 13% of all violations occur on student-serving routes
  • Geographic Correlation: Clear clustering around major CUNY campuses
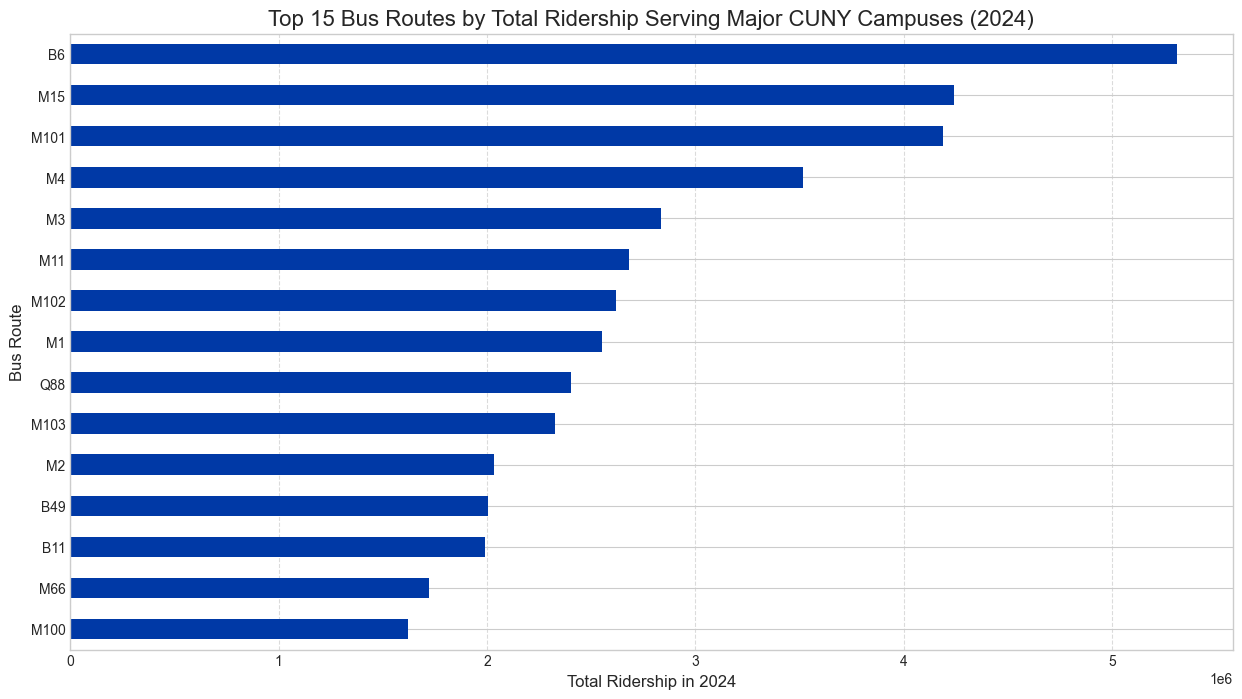
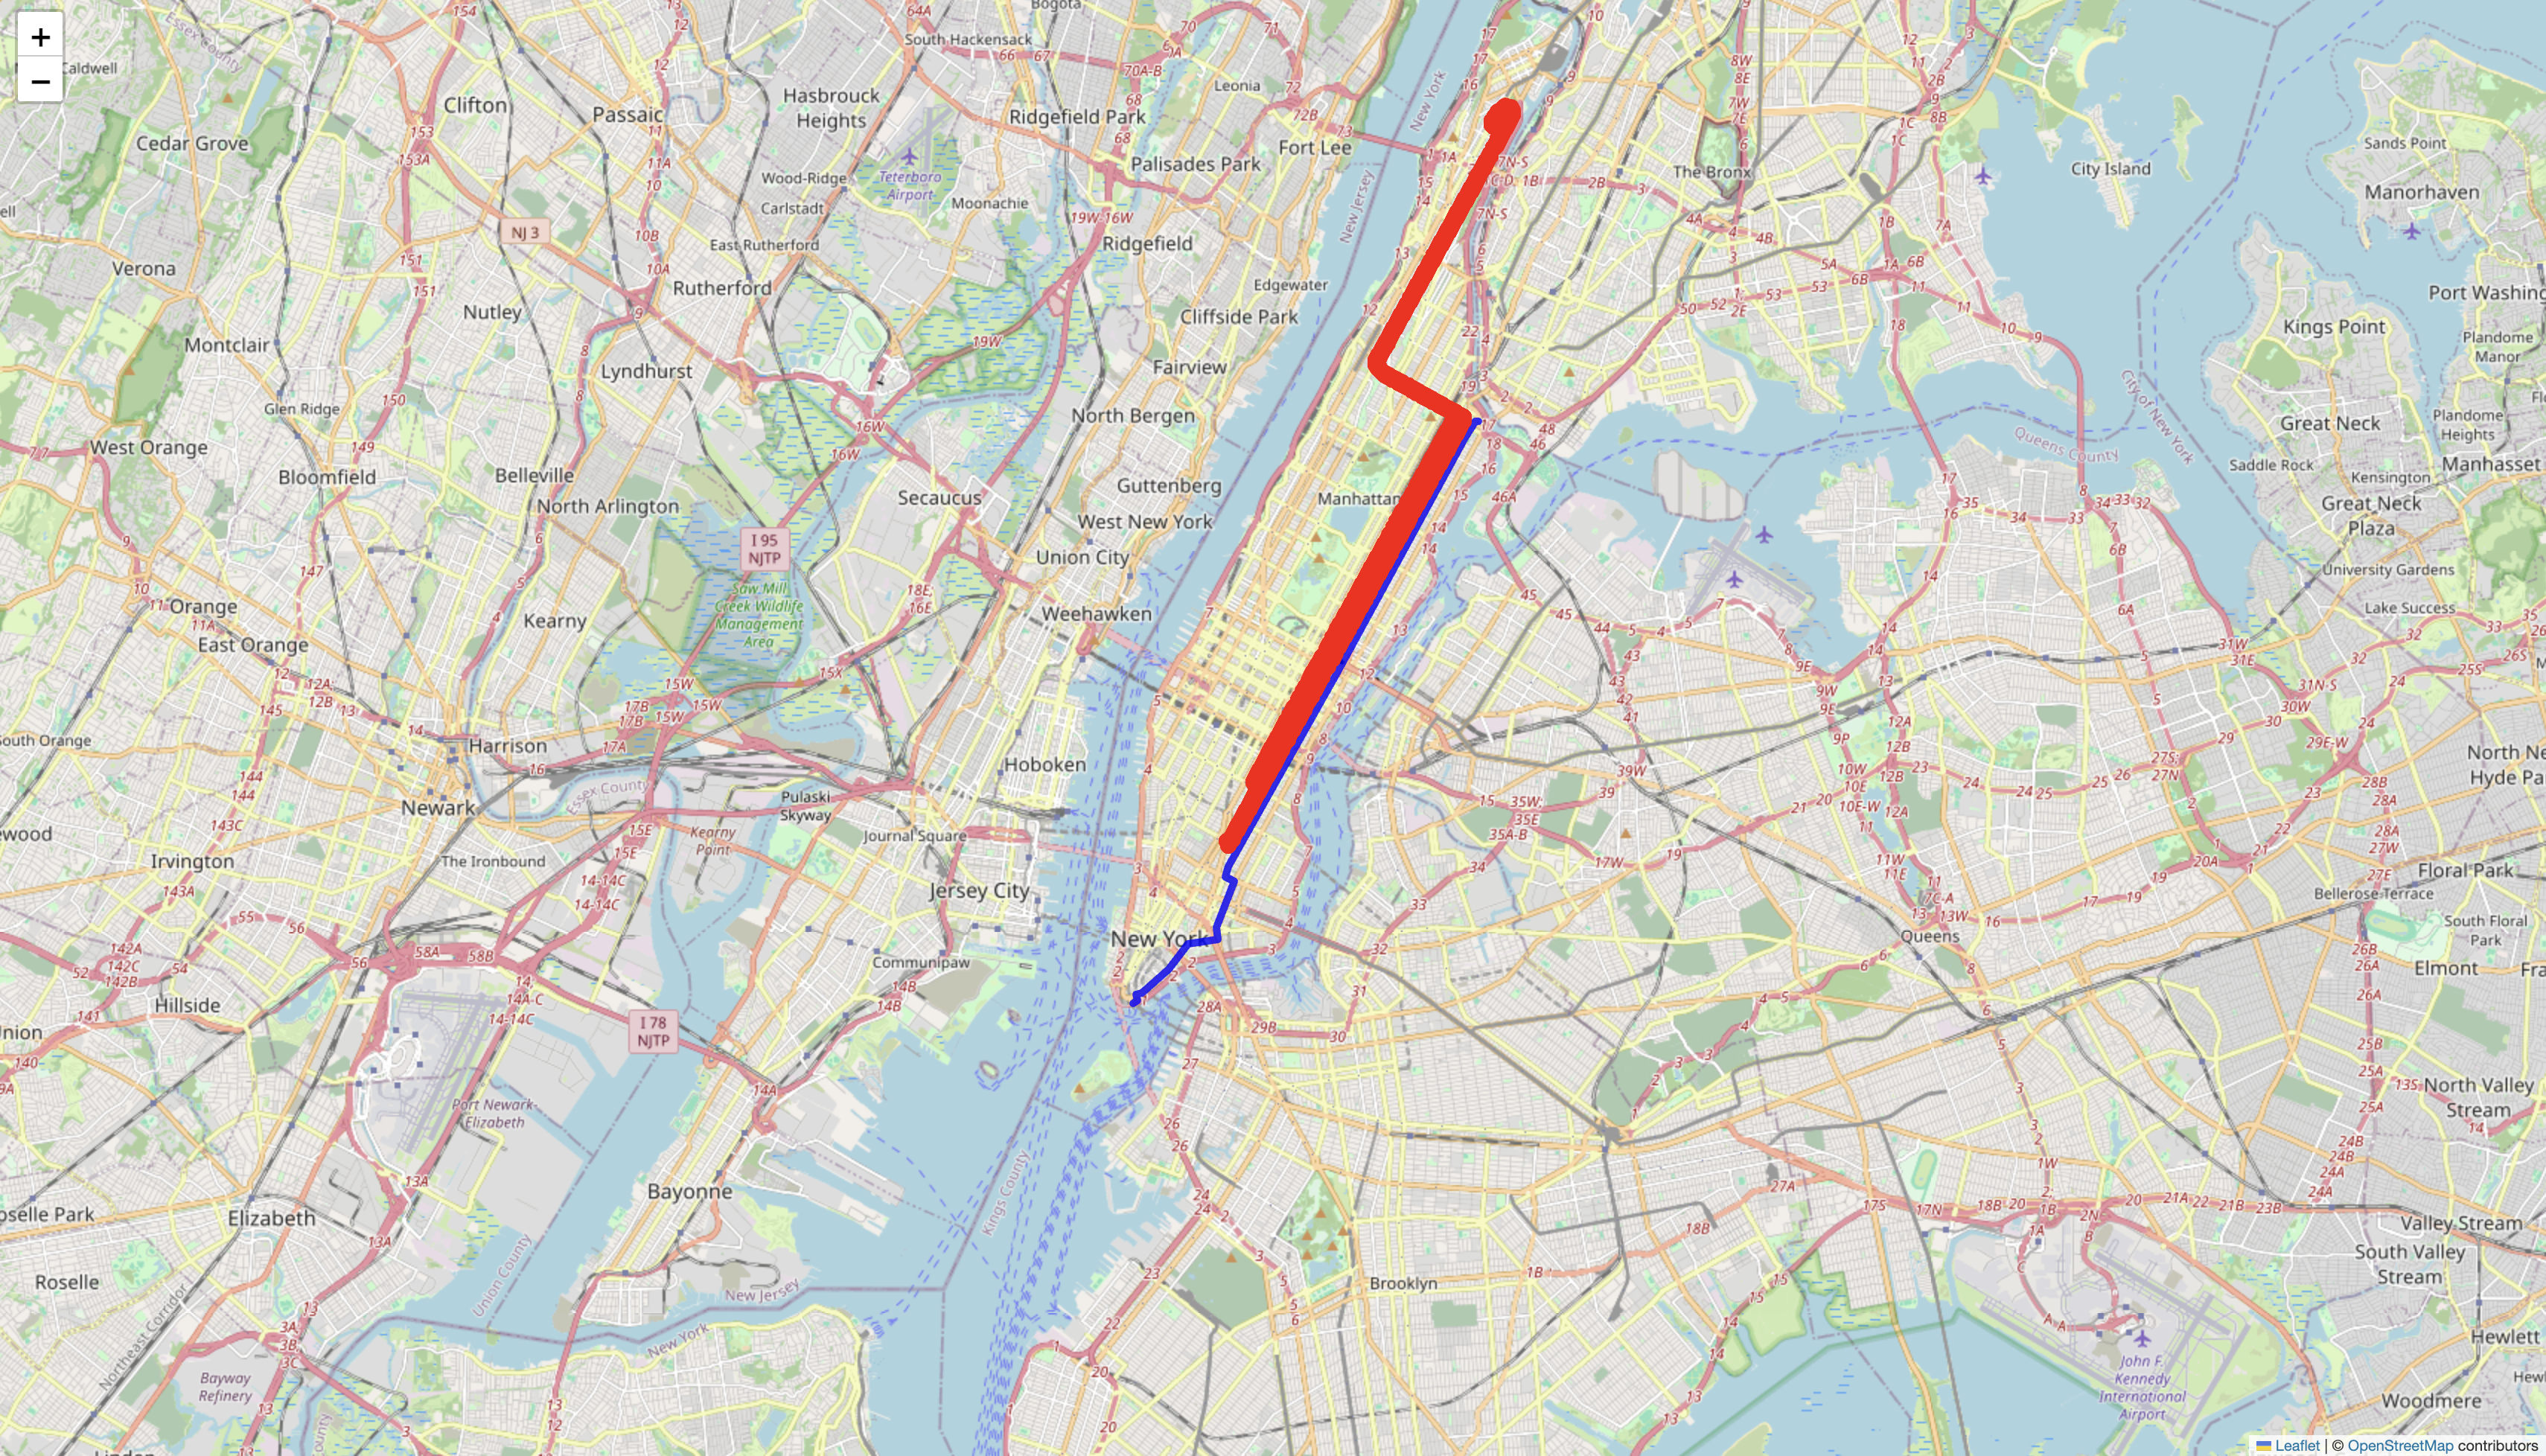
M101 Route Dominance & Geographic Coverage
Interactive Map: M101 (Red) and M15 (Blue) Routes
M101 and M15 Bus Routes Geographic Coverage
CUNY Route Identification
Routes serving Hunter College, Brooklyn College, Queens College, Baruch, City College based on proximity analysis and ridership data
Speed Analysis
Monthly average bus speeds on camera-enforced routes tracked from 2023-2024 showing consistent decline
🚫

Question 2: Exempt Vehicle Violations & Repeat Offenders

Systematic Exemption System Abuse
Analysis reveals widespread exploitation of exemption policies with clear geographic concentration:
  • Total Exempt Violations: 425,814 (25.5% of dataset)
  • Repeat Offenders: 43,170 vehicles with multiple exempt violations
  • Worst Case: Single vehicle with 1,005 exempt violations
  • Revenue Impact: Significant fine avoidance undermining program effectiveness
Violation Status Distribution
Chart: Violation Status Breakdown
Violation Status Distribution
💰

Question 3: Congestion Pricing Policy Impact

Dramatic Policy Success Demonstrates Intervention Effectiveness
Congestion pricing implementation (January 5, 2025) achieved immediate and sustained results:
  • Violation Reduction: 75% decrease in daily CBD violations
  • Before Implementation: ~8,000 violations/day average
  • After Implementation: ~2,000 violations/day average
  • Geographic Scope: Manhattan CBD (below 60th Street)
  • Sustainability: Maintained reduction through August 2025
Violations Timeline: Congestion Pricing Impact
Chart: Daily Violations Over Time
Violations Over Time with Congestion Pricing Impact
📊

Comprehensive Data Analysis

Primary Dataset: NYC Open Data - MTA Bus Automated Camera Enforcement Violations
Analysis Period: 2024 (full year) + 2025 (January-August)
Total Records: 2+ million violation records
Geographic Coverage: All five NYC boroughs with coordinate validation
Route Analysis Methods
  • CUNY campus proximity mapping
  • Ridership correlation analysis
  • Geographic violation clustering
  • Multi-year trend comparison
Policy Impact Assessment
  • Before/after implementation comparison
  • Geographic boundary analysis
  • Daily violation tracking
  • Sustained impact measurement
CUNY-Serving Routes by Total Ridership
Chart: Top 15 CUNY Routes
Top 15 Bus Routes by Total Ridership Serving Major CUNY Campuses

Strategic Policy Recommendations

Student Transportation Equity
  • M101 route infrastructure redesign
  • Dedicated bus lanes on CUNY corridors
  • Increased service frequency during peak academic periods
Enforcement System Reform
  • Stricter exemption approval processes
  • Progressive penalty structure for repeat offenders
  • Geographic monitoring of violation hotspots
Policy Development Strategy
  • Expand congestion pricing model success
  • Prioritize comprehensive interventions over enforcement-only
  • Continuous data-driven monitoring and adjustment